Hello world — meet Trackernaut
Hi there, my name is Jeff Judge and I’m building a new personal dashboard called Trackernaut.
At some point in 2013, I broke a second Fitbit wristband and replaced it with a similar model from Jawbone. Though it was easy to switch devices, I was disappointed that I lost visibility into my historical data, or at least the ability to see it all in one place. This problem compounded over time as I started to use other devices like the Basis watch to track additional data points like my heart rate. My frustration continued to build with an inability to see a cohesive view of my data, so I dug in and found that most of these wearable devices had APIs I could use to fetch my data, and thus the idea for Trackernaut was born.
In December, I started off by building a bare bones web application to fetch cycling data from Strava. I captured basic data points like distance and riding time for each of my rides, stored them in a database, and built a view to look at each ride and year to date mileage. Admittedly, it was easy to get this started using Ruby on Rails, plus the omniauth and omniauth-strava ruby gems to authenticate against the Strava API. I got the proof of concept up and running locally and was happy with the win. Around this time, another company approached with interest to buy the company I had co-founded, thus I put this project and many other things on the back burner to focus on working through the due diligence process. The sale of the company closed in April 2014, and I worked with the acquiring company for the next year to make sure the transition went smoothly. I left the company earlier this year and decided not to rush into anything too quickly. I found myself thinking about this problem and decided to circle back to continue working on what I had started. I cleaned up the code, added support for tracking weight using the Withings scale, and added support for tracking steps with the Moves app. At this point I was at a good place to get the application up and running on the web, so I created an account with Heroku and deployed it. Woot!
Once I had data flowing in, I started to see value right away. For example, here’s a look at my step data over the past 30 days:
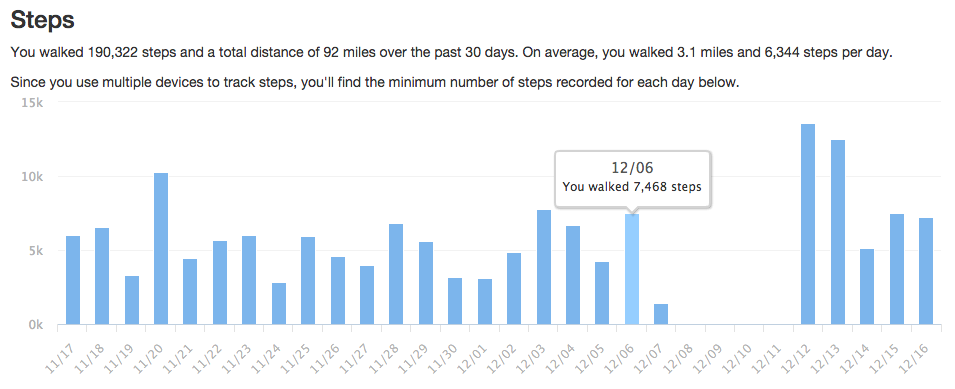 My daily steps over the past 30 days
Looking at this chart, I can see when Moves released a new update to their iOS app that effectively broke it (they released a bug fix the next day). With that, I decided it was a good time to pick up my third Fitbit band and integrate that data too. You’ll notice the spike in number of steps on December 12th and 13th. I had always had a hunch that Fitbit tracked steps more aggressively than others, so it was good to see this new data come in and use it to compare against the Moves data. I reinstalled the Moves app on December 14th and I’m now tracking both sets of step data on a daily basis — something I look forward to writing more about in the future.
Here’s a chart showing my run data from Strava:
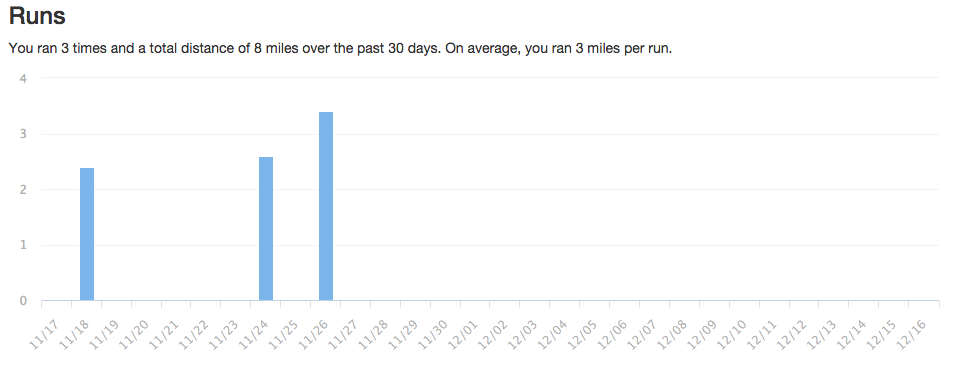 My runs over the past 30 days
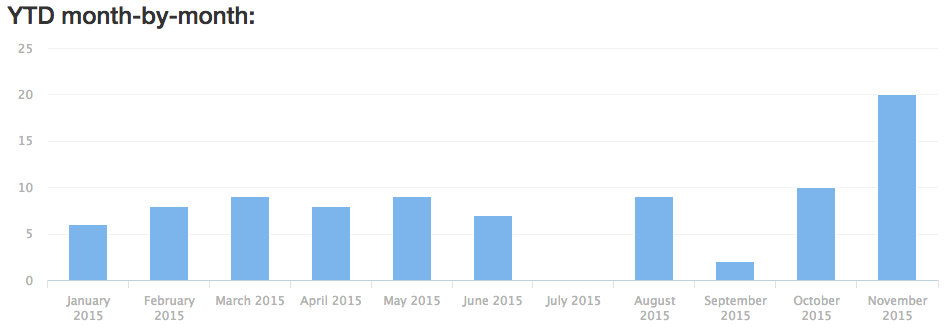
There’s only a three data points, but it’s still helpful for me to see them as I can tell when I picked up a foot injury in November and temporarily stopped running. Looking further back, you can see my runs have picked up towards the end of the year (perhaps why I injured my foot):
Here’s a chart showing my ride data from Strava:
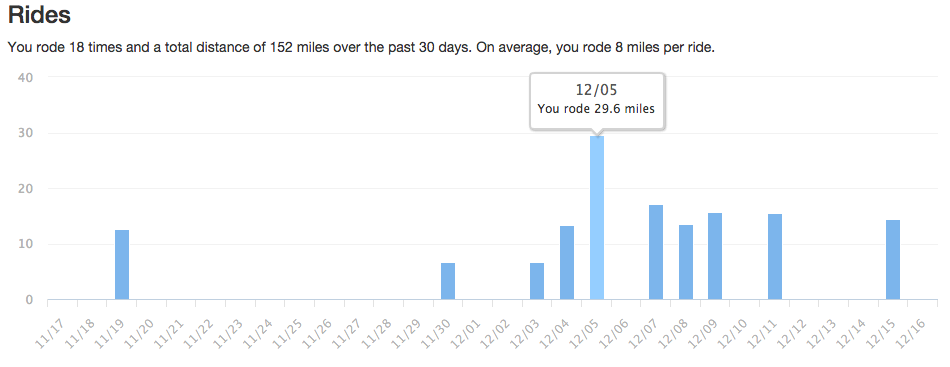 My rides over the past 30 days
Looking at this, I know winter has arrived in Chicago.
Stretching back a bit further in time, you’ll see that I’ve visualized my weight over the past year:
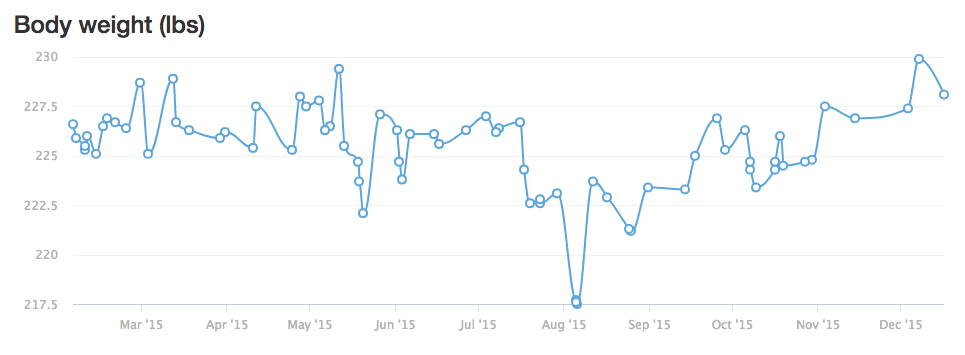 My weight for the past year
I wrote about charting this data in a blog post from May. Below this chart you’ll find two additional charts that show body fat percentage and lean muscle mass, a helpful way to see if I’m gaining, or losing muscle.
While these visualizations have been a fun way for me to spot trends and see the big picture, I’ve also built a low-touch way to keep track of my activities over time through the use of email. At the start of each day, week, and month, Trackernaut sends me a helpful summary recapping the previous period. For example, here’s an email looking back on August 2015:
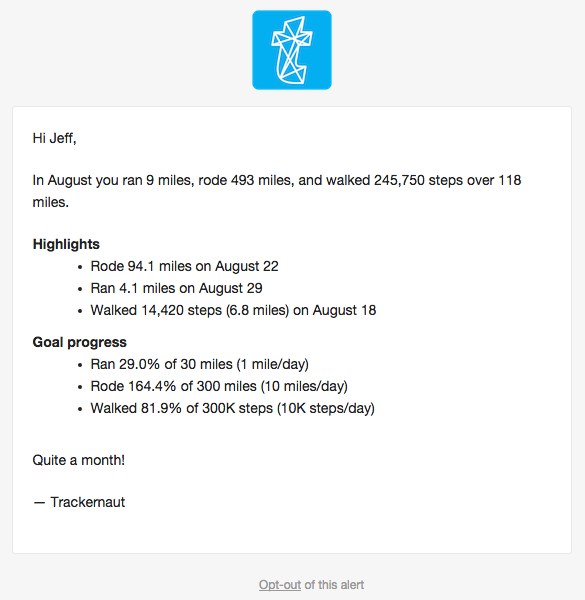
I can see totals and some highlights for each type of activity. I’ve also added some basic goal tracking to show progress against each goal for the month.
Since that initial push in April, I’ve been chipping away at little bits here and there — adding new features, cleaning things up, and trying to add polish where possible. Here’s a look at the Github repo:
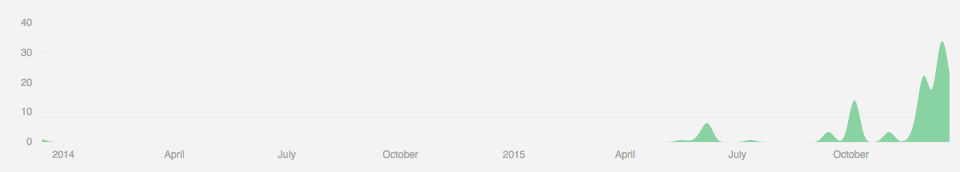 Commits on Github
I now see the formation of something very useful and I’m excited to see where it goes. Please sign up for a Trackernaut account if you’re interested in seeing what your own data looks like (and if you do, send feedback to hello@trackernaut.com). I’ll also be posting updates here and on Twitter (@trackernaut) if you’d like to follow along.
A final note — this is all in fun project mode right now and I don’t yet have any commercial aspirations for this. I built Trackernaut because I wanted to understand more about myself, and didn’t want to rely on others to do this for me. Hopefully it can be helpful for others too.
This post initially appeared on Medium